A lot of our discussion was centered around location, especially since he was thinking of the Ft. Hood shootings and the value of location in determining useful information from the Twitter stream during that crisis. This is what we’ve built Ushahidi around of course, the idea that location and even small bits of information give us a better understanding of an unfolding crisis. This is just as true of mundane information, or trending topics in a locale, which is why Twitter is building a new geo infrastructure. It couldn’t be in better hands either, with both Ryan Sarver and Schuyler Erle on the team, what Twitter puts out will be top notch.
What was more interesting than just geographical references for information was the combination of two other big ways to parse this data: Time an Tags. We’ve started to see a lot more apps mixing time and location in the past year or two, and we’ll see more as the visualizations for it improve. Categorizing information, pictures and video by keywords (tags) have been around even longer.

We need to see more combinations of tags, time and location in visualizations and platforms. I can’t think of anyone who does all three really well (if you can, please leave the link), though there are a number who do two of them incredibly well – including Flickr’s geocoding of images (tag + location), TwitterThoughts (tag + time) and TwitterVision (time + location), etc.
We have a widening stream of information. The lowered barriers for entry globally, and the encouragement by social tools, means we’re seeing exponential growth rates. Twitter alone saw an increase from 2.4 to 26 million tweets per day in just the last 8 months. We need some way to make sense of this information. Our ability to create information has far surpassed our ability to understand it in a timely manner.
Chris Blow outlined this best with a visual for Swift River for use in a presentation I did at TED this year:

It’s a serious problem and one that only gets deeper with every month that passes. In most areas, it’s not a big deal, but when a crisis, emergency or disaster hits the misinformation and lack of understanding has very real consequences.
I’d love to see more work being done with all three: Time, Tags and Location.
]]>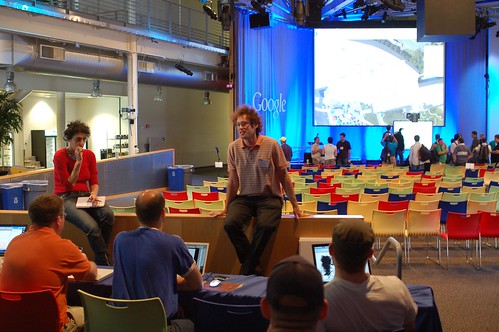
It was a real trip to be amongst some of these true geo/mapping gurus, which led to some great discussions. A few memorable ones:
- The 4th dimension: Time
- Are the big map providers (Google, Yahoo, Microsoft) destroying the mapping ecosystem?
- Using ham radio for location using APRS
- Open Streetmap on how to get better data and simplify the user experience
Of all these discussions I was most interested in the one on “time”. It’s one of the areas that we felt made Ushahidi so much more usable, and so we’re trying to figure out ways to make it even more useful in the next iteration. Time is one of the few variables that hasn’t been well represented in map visualizations, but I think this year will see that change significantly.
And, of course, the lightning rounds were a lot of fun. Each person had 5 minutes to talk about whatever they liked. We heard about everything from geocaching games to visualizing crime via heatmaps, to NNDB’s mapper tool that allows you to map relationships between people and things.
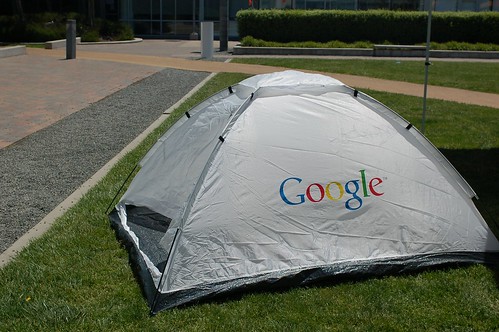
Google handed out tents for all of us, so there were quite a few who camped out in the open area over night. Great way to keep people around, and a fun little item to remember the event by.
[more images on Flickr]
]]>