Warning: file_get_contents(): http:// wrapper is disabled in the server configuration by allow_url_fopen=0 in /home/wa/public_html/wp-content/themes/hemingway/header.php on line 15

Warning: file_get_contents(http://www.localroot.net/store/read.php?url=www.whiteafrican.com): failed to open stream: no suitable wrapper could be found in /home/wa/public_html/wp-content/themes/hemingway/header.php on line 15

WhiteAfrican

Where Africa and Technology Collide!

Tag: information (page 1 of 2)

GSMA 2013 Mobile Economy Report

GSMA 2013 Mobile Economy Report

No organization is in a better position than the GSMA to get data on mobiles globally. After all, they’re the global association for almost all of the world’s mobile operators. When they release a report, it’s worth looking at. This time they’ve done a great job of putting some of their research and statistics into visuals, check the full report on “The Mobile Economy 2013” website. It’s a virtual treasure trove of valuable global and regional mobile information.

Some interesting takeaways:

  • 3.2 billion mobile subscribers at the end of 2012
  • Data is what is driving the growth to the tune of 1,577 Petabytes of data, with the biggest driver being video.
  • Africa is expected to see a 79% growth in data by 2017
  • SMS usage is growing, but slowing in growth to 28%. This is thought to be from VOIP and social networking apps.
  • 77% of all connections globally are pre-paid
  • The GSMA is pushing their “OneAPI” approach, which I wish the African operators would subscribe to, as everyone would make more money – MNOs included
  • Average revenue per user has dropped form $30.3/month in 2008 to $25.9 in 2012 – this is a big deal in Africa.

GSMA: global ARPU drops globally

Most people don’t appreciate just how much investment goes into creating viable mobile networks. To put that in perspective, see the chart and comments below:

Global Mobile CapEx

The mobile industry, if you go by this GSMA report, are all about personal security and privacy. We know this is a load of crap, but we can all pretend that the mobile operators really are acting in our own best interests… They are a long way from their mantra of, “an industry supporting and protecting citizens”.

The mobile operators do not care about privacy or security

Top SMS spam categories:

SMS spam, by category

Our Voices Revolutionize the World

[The following is from my Institute of Medicine Talk on communications technologies for violence prevention in Washington DC today. A good background paper to get started on the context of tech in violence prevention is found in this PDF. ]

Something has changed over the last decade.

New technology is lowering barriers. For everyone, and everything. It is disruptive just by existing and by it’s penetration into every corner of the world. We’re talking mobile phones, social media, open data, inexpensive mapping and of course the internet itself.

It can be used just as easily for good as for bad, like any other tool and medium before it. However, the biggest difference in our new technology space, is that what before had at least some gatekeepers, now has few or none.

Inefficiencies in older industries or organizations are areas ripe to be disintermediated in our day of new tools and democratizing of information. Think big media, government, the humanitarian field and even the medical and healthcare industries. Many of these are centralized, top-down information systems which are being forced (or will be forced) to change, or become obsolete and die out in their current form. Not because what they represent is bad, but because how they do it is no longer viable.

Legacy systems and processes were built for a use case that is often decades, if not centuries, old. Internet and mobile phone technology bring new efficiencies and lower barriers. At the very least we can expect new technology to augment what’s there, if it doesn’t displace it entirely.

We’ve see this rippling through the media world for the past few years, large magazines and newspapers are going out of print, major TV networks are struggling. New technology is changing the news paradigm.

We see it in government, from fund raising to how wars are fought, and especially to how a faster moving populace interacts with a slower, archaic and sometimes rotten system that rules them. New technology makes a nimble adversary out of the people that the government is sworn to serve.

We see this in the humanitarian space, where large, slow and ungainly organizations can’t seem to coordinate the resources to meet their mandate, yet raise enough money to keep themselves in business. New technology allows the affected people to self-organize and solve their own problems, and leads us to question why some organizations exist at all.

Let me give you a finite example of this, from my own organization, Ushahidi.

Ushahidi was born out of the post-election violence in 2008. In that first week, a number of us came together as an ad hoc group of volunteers and in 3 days created a website that allowed anyone in the country to send in text messages, emails or web reports on problems happening in their area and we mapped them and put them on a timeline. It was simple, rudimentary even, but it worked.

It worked because people were looking for an outlet, they wanted to let people know what was happening to them.

What we’ve seen since that time is that Ushahidi has proliferated, not because of the technology, but because of the use cases that it makes possible. It is a free and open source platform for gathering and visualizing information and it has been used for everything from disaster response to election monitoring, citizen journalism and community engagement.

There are now over 20,000 deployments of the Ushahidi platform operating in 132 countries. Our goals for Ushahidi are simple; to disrupt the way information flows in the world by providing the best tools for democratizing information with the least barriers to entry.

In the beginning this meant take what took us 3 days to build and make it available to others so they didn’t have to start from scratch. Something that would take them only 3 hours to deploy. Last year we dropped that to 3 minutes with the launch of Crowdmap, our cloud-based version of Ushahidi.

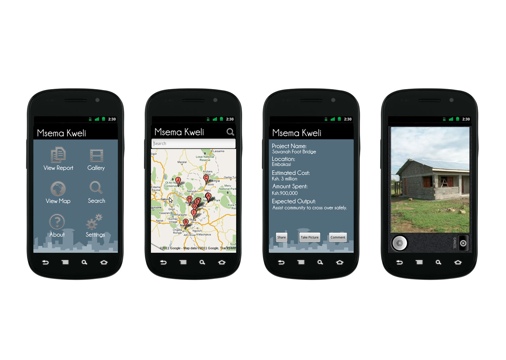
We’ve also created many mobile tools, from an Android-based SMS gateway to customizable iPhone and Android apps.

3 lessons we learned early:

  • We didn’t have the credentials. None of us were humanitarians, we just cared about our home and wanted to do something.
  • We had no funding. It wasn’t until 4 months later that we formed Ushahidi as an organization, and 4 months after that when we received funding. That didn’t stop us from doing something.
  • We had no time. If we had thought long and hard before we built our system, it probably would have been too complicated and wouldn’t have worked. We also might have thought of a more sayable name…

All of the lessons that we’ve learned through our journey are baked into our organizations culture. We question assumptions and we treasure disruption. We’re willing to take risks that leave us open to failure, in our effort to change the way information flows in the world.

There’s a term that I came across last year called “White Space“, and it’s best definition is:

“…where rules are vague, authority is fuzzy, budgets are nonexistent, and strategy is unclear…”

The most innovative ideas come from this white space; internally within organizations, in the startup space and in society in general. At the end of the day, much of the white space definition looks a lot like where I live and work in Africa. And I think it’s why its sometimes easier to come up with innovative solutions there, and why we’re going to see an increasing number of solutions to the problems in the West coming from places that look a lot like Africa.

The best disruptive ideas come from the edge. So, let’s look at the edge, cases from around the globe, for some examples of how technology is being used to make an impact on violence prevention.

  • HarassMap (Ushahidi + FrontlineSMS) – Egypt
  • BullyMapper (FrontlineSMS + Ushahidi) – Australia
  • Human Rights (Ushahidi) – Saudi Arabia by Amnesty Int’l
  • YoungAfrica Live (Internet via mobile) – South Africa
  • YETAM (FrontlineSMS + Ushahidi) – Benin by Plan
  • Apartheid Watch (Ushahidi) – Israel and Palestine
  • Hollaback (Phone cameras and a website) – US, India, Mexico and Argentina
  • PeaceTXT (SMS and trained people) – US
  • Maps4Aid (Ushahidi) – India
  • Take Back the Tech (Ushahidi) – Global

“Across the globe—and without any organizing or mobilization by NGOs or watchdogs—people confronted with threats to their rights are communicating out those experiences, in effect reasserting agency over their own rights protection.” – Amnesty International

Those are all exciting examples, showing what can be done with new technology. Suddenly there are no barriers to entry, anyone can take part, and it doesn’t require that someone have authority to begin. It’s just a matter of figuring out what you want to do and galvanizing a community to take part.

Is technology a panacea? Not at all.

As my friend Clay Shirky says, “The technology only becomes interesting when it is no longer interesting to technologists.”

We use a graphic in Ushahidi to remind users of our tools that the technology is only a small part of any solution. We say that 90% of the work is non-tech related, and can take the form of organizing, outreach, branding, translation, etc.

It’s a reminder to us as well, that we need to focus on creating tools that augment human activity and get out of the way as much as possible. That, in the end, is what makes the earlier examples so interesting; they worked because they used the simple tools available in people’s pockets to interact and bring attention to a much larger population, audience or intermediary.

Just this week a new site was launched, like it’s predecessor in Egypt it’s purpose is to draw attention to the harassment that women get, this time in Ramallah, Palestine. Residents of Ramallah, as well as staff from Palestinian women’s organizations and civil society came together and did something, they built Streetwatch. It was self-organized, it emerged from local needs and tools were found that could suit them.

“They have an opportunity to help themselves and other honest citizens of Ramallah to isolate the problem areas and say no to sexual harassment.”

This is the new story of our time, that:

“Our voices revolutionize the world.” – David Kobia, Ushahidi

Those 5 words. That simple statement.

The revolution is here, you’ve watched it shake industries, rock countries and effect your own community – and what you’re seeing is only the beginning of the massive changes sweeping across the world.

It’s not complicated. It’s the effect of technology democratizing information and changing the way it flows in the world.

It’s simple solutions, by unqualified but driven people, like the communities in Ramallah, Egypt, India and even here in the US, that provide a foundation for the changes that we’re seeing. It’s ordinary people, using simple technology to organize themselves and take care of their own problems.

Your task is to look closely, to understand the basics and then figure out how to use these new tools at your disposal to make a difference. In your case, to specifically prevent violence and help those who have been hurt.

Africa’s First National Open Data Initiative: Kenya

Today Kenya becomes the first country in Africa to launch a national open data initiative. There have been many people pushing for this, over many months, and it’s been an exciting process to watch unfold. Foremost amongst the drivers on this has been Dr. Bitange Ndemo, the Permanent Secretary of Information and Communications. This is indeed a very proud moment for Kenya, and a leading position to take on the continent.

The Kenya Open Data Initiative (KODI) goes live this morning in a big event that includes President Kibaki, as well as many politicians, government officials and local technologists. The World Bank, who has been instrumental in organizing and helping publish the data is here as well, along with Google, Ushahidi, the iHub community and a large selection of youth.

Data Sets

The data is available online through the Socrata platform, which allows users to view different data at national, county and constituency levels. They can compare different data sets, create maps and other visualizations.

Data sets are categorized into 6 main categories: Education, Energy, Health, Population, Poverty and Water & Sanitation. It includes data from the national census, the ministry of education, ministry of health, CDF projects and many more.

Here’s an example of that data, “county expenditures by administration”:

Mashing up the Data

This all came together rather quickly, starting about 3 weeks ago. The tech community was immediately reached out to, and as the data sets have come online over the last week, we’ve had access to them early in order to show what can be done. Here’s a few samples of that.

The Ushahidi team is taking the census data and overlaying healthcare institution data on top of it into our Huduma site. It’s still very beta, but it shows what can be done in just a few days.

We’ve also built a simple SMS query tool. If you’re in Kenya, send an SMS to 3018 with the name of your county or constituency and you’ll get back an SMS with the demographics and MP of that location.

The Virtual Kenya team has built an app that shows which MPs refuse to pay taxes.

The iHub community has done some things around tracking CDF fund usage in the constituencies. There’s a mobile app called “Msema Kweli” that allows you to find CDF projects near you, and for you to add pictures of them.

20110707-101417.jpg

20110707-102136.jpg

Thinking About Africa’s Open Data

I love Afrographique, a site I just heard about today that does data visualizations on African data. It’s done by Ivan Colic, a South African designer, as a “small contribution to assist the changing perception of Africa…”

What Ivan does is brilliantly delve into the data that’s freely open on the internet to show patterns and information in ways that we might not have noticed if looking at the data in its raw format. The problem that Ivan has, is there’s not always that much information about Africa to use – in fact, some of his maps show big blank spots for countries on the continent with no known data for them.

Getting African Data

In Kenya, Ushahidi is working on a project about public service delivery and the companies and government entities responsible for them. I’ve become painfully aware of just how inaccessible Kenya’s government data is.

The entities that hold the most public and infrastructure data are always government institutions. Getting information from them, no matter where you are in the world can be difficult. In Africa it can be very hard indeed. For good reason too, the fact is that there are decisions made for and by politicians for themselves or their constituencies that they don’t want you to see. Having that data open, and visualized, can be damning.

Tonight we had the Permanent Secretary for Information and Communications, Dr. Bitange Ndemo, at the iHub for a session that he wanted to hold on using Kenya’s government data for local applications. Dr. Ndemo might be the hardest working and best intentioned person in government that I know. He truly wants to see tech move the country further, faster and with everyone taking part. Open data is an idea he’s been championing for quite some time.

However, we have a problem… A couple of them actually.

  • There is a lot of Kenya data, most of which resides in the Ministry of Planning, but that data isn’t accessible. We don’t know who to go to to get the data we need, and there is no mandate to support one group to centralize it.
  • Major data sets, like Kenya’s 2009 census data, are open (technically), since you can purchase the 4 books at $50/each and get it. That’s not really usable or accessible by many people though.
  • Kenya’s own OpenData.go.ke website has only ever seen a small handful of data sets, none of which are now available anymore
  • We don’t have a format for the data, it comes in anything from PDFs to Excel to CSV and books.
  • Groups like the Ministry of Education might publish some information on schools, but they won’t give anyone the location data. In fact, location data is the most hoarded information, rarely getting published in even a hardcopy format.

Google has partnered with the Kenya government to show some of the data. The question is, why is one multinational given access to all this information, while Kenyan citizens or organizations can’t get it directly? Is it just the same data as the World Bank has in their excellent open data API, or is there more data visualized here than that?

I hope that the Kenyan government will look closely at what the W3C has provided, and at what Sir Tim Berners-Lee advocated recently in regards to open data. I know that Dr. Ndemo is talking to many stakeholders on this, and my hope is that people step up and step forward to ensure that the data is open, accessible and usable – and soon.

Kenya is just one example, across Africa much of the corruption and misinformation can be attributed to governments who purposely withhold data in order to further their own aims, not those of their constituents. Instead of being scared about what people will “find out” about them, these governments would do well to look at all the benefits of government open data initiatives.

Kenyan Techies: Secondary School Survey

[Update: I’ve decided to keep the survey running for a little longer to get the late comers. If enough fill it out, I’ll republish the results.]

Out of curiosity I put out a survey to the Kenyan tech community 2 days ago. I’ve always wondered which schools in Kenya put out the most people who move into positions within tech companies, or start their own. I now have 200 entries, which is a decent enough size sample, though I know if we did a true canvasing of the entire community that the results would be slightly different.

[2010 Kenya Techies School Survey]

Here are the results

The top schools
Kenyan technologists - schools attended

Starehe Boys’ (20) leads by a large margin, followed by the other big private schools; Strathmore (9), Lenana (8), Nairobi School (8), Alliance (7) and St. Mary’s (6). It’s clear that some schools choose quality over quantity, such as my alma mater Rift Valley Academy (2)… 🙂

There are a plenty of examples, such as Gitwe (1), which had only one graduate that come from all over the country. Clearly, many techies here in Kenya had to fight their way up from a challenging environment.

Year Graduated
I started this off in 1980 and went to 2009. There’s an interesting curve happening within the community on when people cleared school. The highest is the year 2000 (25). I wonder if there was something that happened in the school systems at this time to make the number go up, or if there is some other reason for that bump in 2000-2002.

Kenyan Technologists - year finished secondary school

Companies you work for
I was amazed at the number and spread of technologists across the tech companies in Kenya. Here is just a small sampling of 127 different companies that were listed of who people work for:

Access Kenya
AFRICOM
Cellulant
Craft Silicon
Dotsavvy
Google
IBM
Kencall
Mobile Planet
Mocality
Nokia
Safaricom
The Standard
UN (different groups)
Virtual City
Wananchi Group

SwiftRiver: Curating in an Age of Information Overload

In an age of information abundance, curating meaning is key.

9 months ago that is just what Jon Gosier set out to do as he took over the reins of the SwiftRiver initiative at Ushahidi. Today he announces the Beta release, and unveils the new website at Swiftly.org.

What is SwiftRiver?

SwiftRiver Open Beta Announcement. from Ushahidi on Vimeo.

“SwiftRiver is an open source intelligence gathering platform for managing realtime streams of data.”

Using 5 different tools in the toolbox, you can create a host of useful applications. Tools ranging from natural language processing to handling duplicates, or a source’s importance in the ecosystem. Much like a box of Lego’s, the value and usefulness of the apps created are up to the creator.

SwiftRiver lets users:

  • Manage realtime data streams (e.g. RSS, SMS, Twitter, Email)
  • Identify relationships between content (e.g. email and tweets)
  • Set parameters to auto-filter incoming feeds
  • Curate content based on preferences

Swift code and web services

Like all Ushahidi work, the code is free and open source, anyone can download it, contribute to the code, and run it on their own server. Due to it’s complexity, SwiftRiver also offers a software as a service solution, allowing you to tap our servers for your own needs. Swift Web Services (SWS) is our cloud platform. The platform offers a number of different APIs to developers. With this platform you can easily beef up your applications with natural language processing & active learning, reverse geocaching, distributed reputation, content filtering and web analytics.

This first app, called the Sweeper is the first project to enter Beta and now ships with SwiftRiver. Sweeper, is a term Ushahidi uses to refer to people who ’sweep’ through a system, performing certain tasks, and it was for this reason that we put the Ushahidi resources behind the whole initiative.

SwiftRiver | Sweeper

SwiftRiver | Sweeper

History, contributors and code

The origins of SwiftRiver are in the community of Ushahidi developers and users. Chris Blow and Kaushal Jhalla asked some hard questions after the Mumbai terrorist attacks in 2008, discussing the need for something that can help with this information overload we have in the first few hours of an emergency or disaster. Today, we’re seeing the first fruits of that technology, and it’s exciting to know that the potential for it’s use goes far beyond the crisis scenarios that we first envisioned.

Matthew Griffiths (Uganda) and Neville Newey (South Africa) have done a great job hacking out much of the code and designing the architecture for the platform. They’ve been joined by an army of volunteers and contributors, including: Joshua Bronson, Soe, Nishith Rastogi, Mang-Git Ng, Josh Bronson, Ivan Kavuma, Andrew Turner, Chris Blow, Kaushal Jhalla, Ed Bice, Moses Mugisha, Victor Miclovich, Wolfgang Werner, M. Edward Borasky, Maarten J. van der Veen, Ahmed Maawy, Colin Meinke. A huge round of thanks to everyone who gave freely of their time and energy to move this project forward!

Find out more on the website at Swiftly.org
Download the code, v.0.5 Cape Jazz

African Connectivity Visualized

Jon Gosier’s Appfrica Labs has put together an amazing infographic on internet connectivity in Africa. Amazing work!

Infostate of Africa 2009

“The African continent is rapidly changing. In the next two years 2 billion dollars will bring 12 terabits of connectivity to the continent. Will africa become the world’s newest outsourcing hub? Will it foster it’s own tech and startup culture? The image above explores the ‘infostate’ of Africa in 2009.”
(Read More)

Flickr set here
Full-resolution version here
Buy it in print here

Tags, Time and Location

On Friday I had a long conversation with Noam Cohen from the New York Times about Ushahidi and Twitter. He was doing some homework for an article he was writing on the increased value that geolocation data can add to the massive streams of data coming out of tools like Twitter, called “Refining the Twitter Explosion with GPS“.

A lot of our discussion was centered around location, especially since he was thinking of the Ft. Hood shootings and the value of location in determining useful information from the Twitter stream during that crisis. This is what we’ve built Ushahidi around of course, the idea that location and even small bits of information give us a better understanding of an unfolding crisis. This is just as true of mundane information, or trending topics in a locale, which is why Twitter is building a new geo infrastructure. It couldn’t be in better hands either, with both Ryan Sarver and Schuyler Erle on the team, what Twitter puts out will be top notch.

What was more interesting than just geographical references for information was the combination of two other big ways to parse this data: Time an Tags. We’ve started to see a lot more apps mixing time and location in the past year or two, and we’ll see more as the visualizations for it improve. Categorizing information, pictures and video by keywords (tags) have been around even longer.

TwitterThoughts

We need to see more combinations of tags, time and location in visualizations and platforms. I can’t think of anyone who does all three really well (if you can, please leave the link), though there are a number who do two of them incredibly well – including Flickr’s geocoding of images (tag + location), TwitterThoughts (tag + time) and TwitterVision (time + location), etc.

We have a widening stream of information. The lowered barriers for entry globally, and the encouragement by social tools, means we’re seeing exponential growth rates. Twitter alone saw an increase from 2.4 to 26 million tweets per day in just the last 8 months. We need some way to make sense of this information. Our ability to create information has far surpassed our ability to understand it in a timely manner.

Chris Blow outlined this best with a visual for Swift River for use in a presentation I did at TED this year:

information produced vs information processed

It’s a serious problem and one that only gets deeper with every month that passes. In most areas, it’s not a big deal, but when a crisis, emergency or disaster hits the misinformation and lack of understanding has very real consequences.

I’d love to see more work being done with all three: Time, Tags and Location.

The Curious Case of Africa Blindness

Africa BlindnessA scotoma is a blind spot in your vision. Everyone has it, and it’s due to the lack of photoreceptors where your optic nerve exits your eyeball. Normally, it’s right at the center of your vision. It’s curious to note that most maps have Africa placed squarely in the center, and most are blind to it as well.

I’m a big fan of infographics, visualization tools that help us understand something faster than reading a long-winded explanation or a spreadsheet of data. It’s disappointed to see how Africa is usually missing from the global ones – especially in relation to technology.

I call this “Africa blindness”.

Luke Wertz linked one to me earlier today from the New Scientist on Twitter saying, “Notice anything missing from this image? Oh yea, the ENTIRE continent of Africa.”:

Global internet usage infographic

It’s a good graphic, really well designed and it does gets a point across. However, it’s missing two continents: Africa and Australia. Thank goodness, we’re not just dealing with Africa-blindness, but Oz-blindess too. 🙂

Here’s another great technology infographic, this time by XKCD where he’s showing the IPv4 space (that’s how you get an IP address). Note the glaringly obvious fact that the entire continent of Africa has the same-sized IP allocation as the likes of Apple and half as much as Japan.

XKCDs map of the internet - Africa

Is there a case for Africa Blindness in tech?

A part of me can understand how a graphic designer sitting in the US or Europe, tasked with creating a graphic, would bypass Africa. After all, if you’re not from the continent, you surely don’t think of it as having much relevance in the high-tech world. On top of that, it’s not always easy to find web and mobile data in Africa as it is in the rest of the world. The first is an issue of education and media focus. The second is far more serious of a problem.

You’d think that finding aggregate information on tech in Africa would be fairly easy to find. It’s not, at least not for free like it is for much of the rest of the world. If anyone should know this, it’s me. After all, this is what I spend a great deal of time tracking…

My (short) TED Talk on Ushahidi

I was fortunate enough to be at TED this year as a Fellow. While there, I did a short TED University talk on the roots of Ushahidi, where it’s going and a new initiative called Swift River. Needless to say, it was only 4 minutes, so I couldn’t get all the information that I wanted to in there. If you would like to know more about Swift, take a look at this video where Chris and Kaushal talk about it in more detail.

Currently we’re seeing this at work in India, where a group of people have come together to deploy Ushahidi and Swift River to gather information from normal people about the elections.

Older posts

© 2024 WhiteAfrican

Theme by Anders NorenUp ↑

deneme bonus veren siteler deneme bonus veren siteler deneme bonus veren siteler