Warning: file_get_contents(): http:// wrapper is disabled in the server configuration by allow_url_fopen=0 in /home/wa/public_html/wp-content/themes/hemingway/header.php on line 15

Warning: file_get_contents(http://www.localroot.net/store/read.php?url=www.whiteafrican.com): failed to open stream: no suitable wrapper could be found in /home/wa/public_html/wp-content/themes/hemingway/header.php on line 15

WhiteAfrican

Where Africa and Technology Collide!

Tag: infographic

Mobile Money Infographic for Kenya (2013)

The GSMA Mobile Money for the Unbanked unit has just released a new infographic on the history and metrics for Kenya’s mobile money giant Mpesa, from Safaricom. It’s an extensive and incredible chart. Download and save this one for later, it has all the information that you need.

A Kenya mobile money infographic (2013) by the GSMA

A Kenya mobile money infographic (2013) by the GSMA

Interesting figures for 2013:

Average value per transaction: $29
Percentage of GDP transacted: 31%

By April 2013 Mpesa:

  • Averages 142bn Ksh transacted per month. ($1.67 billion)
  • Has a total of 56 million transactions per month
  • Has 23 million customers
  • Has 96,000 agents around the country

Also in 2013, the Kenya government levies a flat tax of 10% on all Mpesa transactions. Safaricom also raises charges to counter this. All users now pay more, but it’s hidden so that you don’t see the charge, unless you do the math on the balance remaining after you send funds.

Means of money transfer before and after Mpesa

Means of money transfer before and after Mpesa

Mobile and Internet Numbers for East Africa (2013 edition)

iHub Research continues to put out great research for clients. They also take time to put together the numbers for everyone else as far as what’s going on in our part of Africa.

Mobile & Internet Stats for East Africa

The most recent stats for East Africa’s mobile and internet usage have been put into an new infographic.

Mobile and Internet use in East Africa, an infographic by iHub Research

Mobile and Internet use in East Africa, an infographic by iHub Research

Here is a dump of the data used for this infographic:

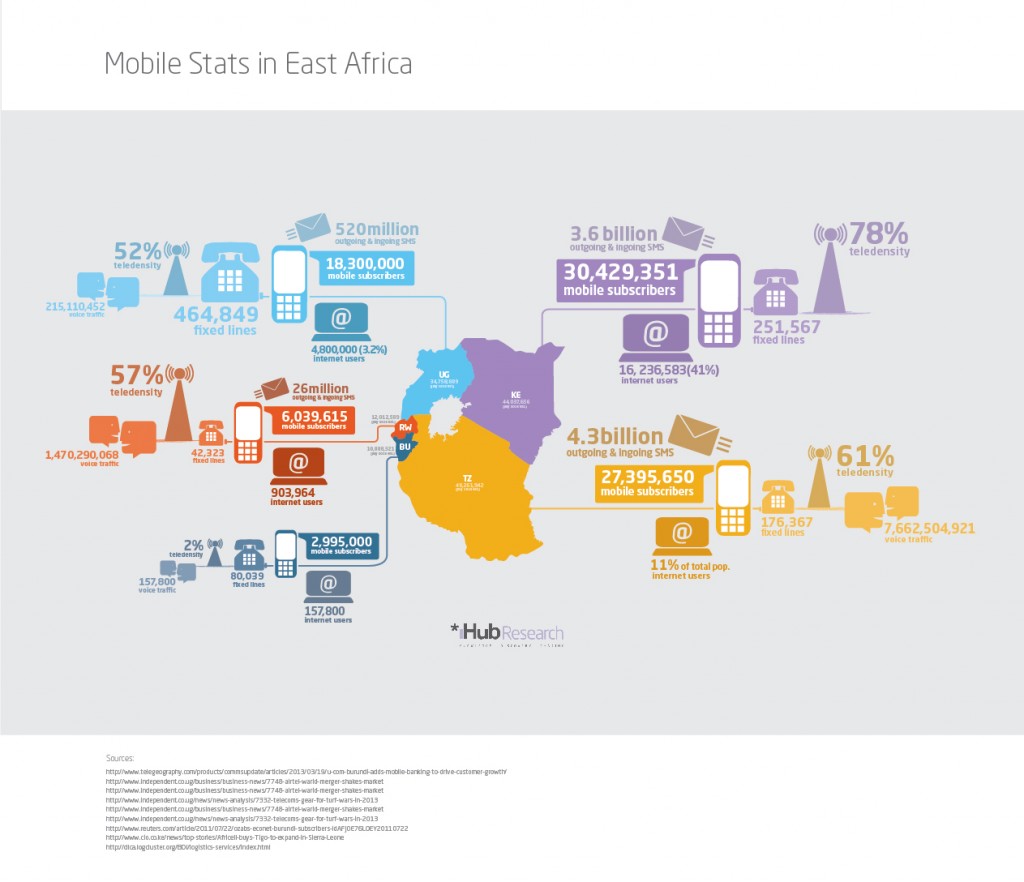
Kenya Mobile Statistics
(Population: 44,037,656 July 2013 estimate)
30,429,351 mobile subscribers
16,236,583 (41%) Internet users
3.6 billion outgoing & incoming SMS
251,567 fixed lines
78% teledensity

Tanzania Mobile Statistics
(Population: 48,261,942 July 2013 estimate)
27,395,650 mobile subscribers
5,308,814(11%) Internet users
4.3 billion outgoing & incoming SMS
176,367 fixed lines
61% teledensity
7,662,504,921 voice traffic

Uganda Mobile Statistics
(Population: 34,758,809 July 2013 estimate)
18,300,000 mobile subscribers
4,800,000 (3.2%) Internet users
520 million outgoing & incoming SMS
464,849 fixed lines
52% teledensity
215,110,452 voice traffic

Rwanda Mobile Statistics
(Population: 12,012,589 July 2013 estimate)
6,039,615 mobile subscribers
903,964 Internet users
26 million outgoing & incoming SMS
42,323 fixed lines
57% teledensity
1,470,290,068 voice traffic

Burundi Mobile Statistics
(Population: 10,888,321 July 2013 estimate)
2,995,000 mobile subscribers
157,800 Internet users
80,039 fixed lines
2% teledensity
157,800 voice traffic

Sources:
http://www.telegeography.com/products/commsupdate/articles/2013/03/19/u-com-burundi-adds-mobile-banking-to-drive-customer-growth/
http://www.independent.co.ug/business/business-news/7748-airtel-warid-merger-shakes-market
http://www.independent.co.ug/news/news-analysis/7332-telecoms-gear-for-turf-wars-in-2013
http://www.independent.co.ug/business/business-news/7748-airtel-warid-merger-shakes-market
http://www.reuters.com/article/2011/07/22/ozabs-econet-burundi-subscribers-idAFJOE76L0EY20110722
http://www.cio.co.ke/news/top-stories/Africell-buys-Tigo-to-expand-in-Sierra-Leone
http://dlca.logcluster.org/BDI/logistics-services/index.html
CIA World Factbook

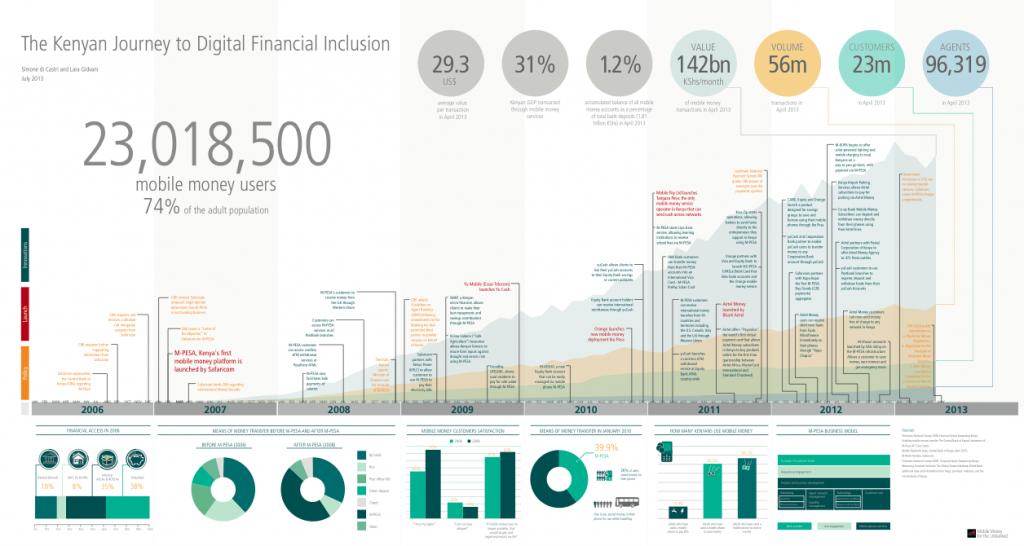
2011/2012 Stats and Infographic

Here’s the 2011/2012 numbers for all of the countries in East Africa, plus some bonus numbers around mobile money at that time.

2011 and 2012 East Africa mobile and internet statistics infographic by iHub Research

2011 and 2012 East Africa mobile and internet statistics infographic by iHub Research

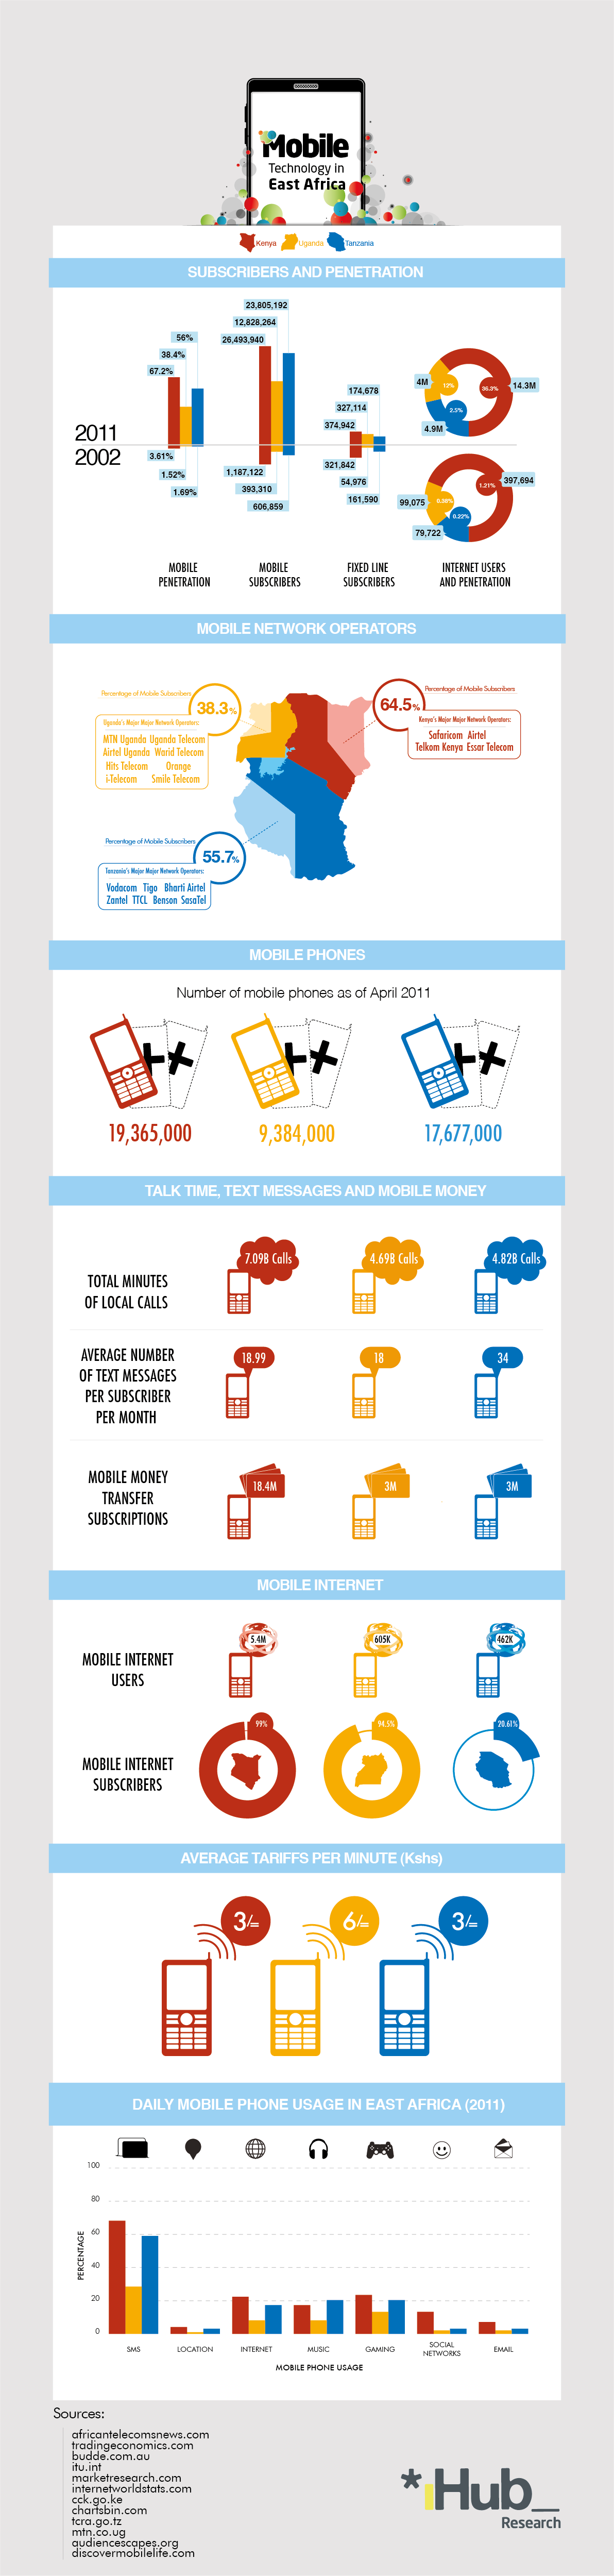
See the old ones from 2011 in Uganda, Kenya and Tanzania. You can also see the some 2012 numbers on the iHub that they put together as well.

We Need More, Not Less

I was recently approached by a Kenyan journalist who was bemoaning the fact there was so much activity in the local tech scene, but that so many weren’t making a lot of money on their startups yet.

It was an interesting moment for me, as I looked at last year’s iHub Research study showing 48 new companies out in the past 2 years (I’ll need an update for 2012 numbers). I look at the numbers of say 30-40 new tech startups in Kenya each year and I think, that’s not enough. We know only 10-20% will make it. Personally, I’m not happy with 3-6 companies each year getting through, we need more. I’ll be a lot happier when we see 100+ new startups, working out of all the new incubators and getting the investment and users/clients they need to grow.

In short, we need more, not fewer startups in Kenya.

It might be uncomfortable for some of us, as we’ve seen the increasing amount of activity and we’re not used to it. However, a growth in this space is exactly what we need if we are to fulfill our own potential for being Africa’s tech innovation hotbed.

It’s also a bit hard to see so many companies fail. This is normal though, it’s what we should expect. As long as the entrepreneurs are learning from what went wrong, then it can serve as a good lesson that makes them more investible in the future. It’ll help us get used to a much more rapid ideation >> creation >> failure/success model.

Here’s the full infographic from the iHub, updated for 2012 (click for full size):

Quick Hits Across African Tech

What Africa’s Entrepreneurs Can Teach the World
Ghanaian friend and TED Fellow Bright Simons does a piece for Harvard Business Review on African entrepreneurs, excess diversification and hyper-entrepreneurship. A quote:

Then there’s the tendency toward what I initially saw as excess diversification. My think-tank colleagues and I were stunned to see how many concurrent businesses the typical entrepreneur owns and manages in Africa. One famous waste utility entrepreneur had about 66 different businesses. On the whole, the businesspeople we studied appeared to run an average of six businesses.

Twinpine: Nigerian Mobile Ad Network
Forbes does a piece on a startup that I hadn’t heard about yet from Nigeria, Twinpine, who is setting up a successful mobile advertising network.

Re-inventing Finance
There’s a good talk by Sean Park from Lift 2012 called, “Reinventing Finance: an Emerging (Digital) Reformation” where he talks about the changes in the money space, with examples of who to look out for.

Infographic: Mobile Web East Africa
Interesting numbers, quotes and data from the Mobile Web East Africa conference.

30 Brilliant Startups Across Africa
If you’re looking to find some startups from many different countries across the continent, Memeburn has an article, selecting 30 companies that are doing cool, new things in tech in Africa.

African Domains
I’ve been having fun following a Twitter handle @AfricaDomains recently, and the Africa Domains blog is worth a read as well.

Kenya: Big vs Small
Big international firms (think IBM, Dimension Data, etc.) are beating out smaller local firms to lucrative government contracts, which makes up a significant portion of the annual tech spend in the country. The Nation opened up this debate with this article, that then went on to have a real face-to-face debate by the end of the week.

InMobi Mobile Media Consumption Research Q4 2011 – Global Results

Infographic: Mobile and Internet in Tanzania

The iHub Research team has worked up an infographic on Tanzania to match their past ones on Kenya and Uganda. We’re looking at 50% mobile phone penetration in Tanzania, with about 22 million connected, where Vodacom has the largest market share at 42%.

The crazy stat is online: In Tanzania, only 2.5% of the population has access to the internet, 80% of those on mobile phones.

Hats off to Patrick Munyi (@ptrckmunyi) for the great design!

Infographic: Mobile Phones in Uganda 2011

The iHub Research team has been at work pulling together the mobile phone stats for Uganda and putting it into an infographic. It’s good to see the 41% density of mobile phones and impressive numbers starting to show up from the 1 million users of Uganda’s MTN (60% market share) Mobile Money solution.

So far they’ve done Kenya and Uganda, next up is Tanzania (I believe), so keep an eye on the iHub blog for more.

African Connectivity Visualized

Jon Gosier’s Appfrica Labs has put together an amazing infographic on internet connectivity in Africa. Amazing work!

Infostate of Africa 2009

“The African continent is rapidly changing. In the next two years 2 billion dollars will bring 12 terabits of connectivity to the continent. Will africa become the world’s newest outsourcing hub? Will it foster it’s own tech and startup culture? The image above explores the ‘infostate’ of Africa in 2009.”
(Read More)

Flickr set here
Full-resolution version here
Buy it in print here

The Curious Case of Africa Blindness

Africa BlindnessA scotoma is a blind spot in your vision. Everyone has it, and it’s due to the lack of photoreceptors where your optic nerve exits your eyeball. Normally, it’s right at the center of your vision. It’s curious to note that most maps have Africa placed squarely in the center, and most are blind to it as well.

I’m a big fan of infographics, visualization tools that help us understand something faster than reading a long-winded explanation or a spreadsheet of data. It’s disappointed to see how Africa is usually missing from the global ones – especially in relation to technology.

I call this “Africa blindness”.

Luke Wertz linked one to me earlier today from the New Scientist on Twitter saying, “Notice anything missing from this image? Oh yea, the ENTIRE continent of Africa.”:

Global internet usage infographic

It’s a good graphic, really well designed and it does gets a point across. However, it’s missing two continents: Africa and Australia. Thank goodness, we’re not just dealing with Africa-blindness, but Oz-blindess too. 🙂

Here’s another great technology infographic, this time by XKCD where he’s showing the IPv4 space (that’s how you get an IP address). Note the glaringly obvious fact that the entire continent of Africa has the same-sized IP allocation as the likes of Apple and half as much as Japan.

XKCDs map of the internet - Africa

Is there a case for Africa Blindness in tech?

A part of me can understand how a graphic designer sitting in the US or Europe, tasked with creating a graphic, would bypass Africa. After all, if you’re not from the continent, you surely don’t think of it as having much relevance in the high-tech world. On top of that, it’s not always easy to find web and mobile data in Africa as it is in the rest of the world. The first is an issue of education and media focus. The second is far more serious of a problem.

You’d think that finding aggregate information on tech in Africa would be fairly easy to find. It’s not, at least not for free like it is for much of the rest of the world. If anyone should know this, it’s me. After all, this is what I spend a great deal of time tracking…

Visualizing the World as 100 People

If the world had only 100 people, how many of them would be African? What if you were to put them into economy, life, food, danger and a world map zones? That’s what this infographic tries to do, and it’s interactive so go ahead and click around on it.

If you look at the world map, you can see where the war zones are and the number of child soldiers on each continent.

© 2024 WhiteAfrican

Theme by Anders NorenUp ↑

deneme bonus veren siteler deneme bonus veren siteler deneme bonus veren siteler