It’s interesting to see where the Kenyan tech community went to school, what years we graduated, where we work and what age we first started using computers regularly. As I did in 2010, here are the survey results for 2013, with 627 responses.
The live survey link.
[Kenya Tech Community 2013 Survey Base Excel File]
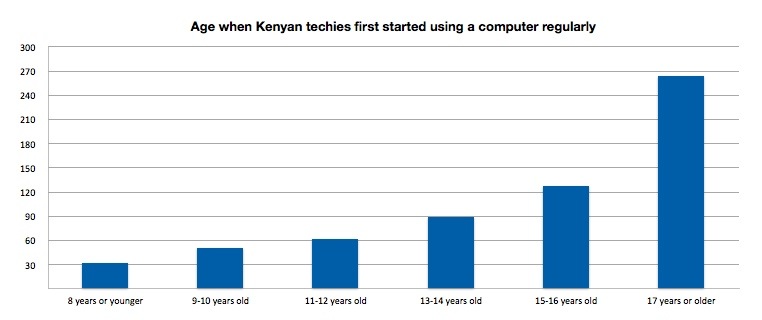
What age did you first start using a computer regularly?
You can see that we tend to get on computers when we are older, at 17+ (that’s 42% of us). There’s a definite need to get more computers into classroom settings, or homes, at a younger age.
Another view of the same age chart:

- 32 People got onto computers at 8 years or younger
- 51 People got onto computers at 9-10 years old
- 62 People got onto computers at 11-12 years old
- 89 People got onto computers at 13-14 years old
- 128 People got onto computers at 15-16 years old
- 264 People got onto computers at 17 years or older
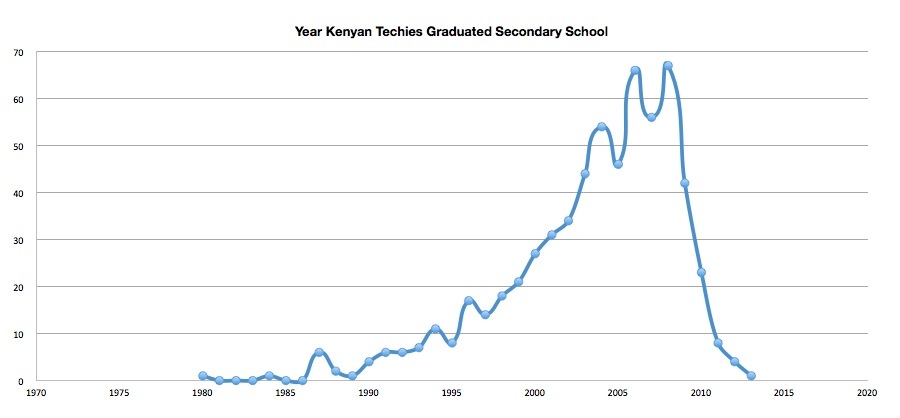
Years that the Kenyan tech community graduated from secondary school
Which schools did we graduate from?
The schools were across the spectrum. I don’t have the locations of each one, but it would be interesting for someone with the ability to pinpoint them, to do a heatmap of the country based on the school graduates from each location.
1980 – 1
1981 – 0
1982 – 0
1983 – 0
1984 – 1
1985 – 0
1986 – 0
1987 – 6
1988 – 2
1989 – 1
1990 – 4
1991 – 6
1992 – 6
1993 – 7
1994 – 11
1995 – 8
1996 – 17
1997 – 14
1998 – 18
1999 – 21
2000 – 27
2001 – 31
2002 – 34
2003 – 44
2004 – 54
2005 – 46
2006 – 66
2007 – 56
2008 – 67
2009 – 42
2010 – 23
2011 – 8
2012 – 4
2013 – 1
Here are the top 6 girls schools (I had a hard time knowing which were strictly girls schools):
- 9 Moi Girls Nairobi
- 6 Kianda Girls
- 4 Pangani Grils HS
- 4 St. George’s Girls HS
- 3 Alliance Girls HS
- 3 Limuru Girls
Here are the top 12 boys schools (I think some might be mixed, like Kabarak):
- 29 Starehe Boys
- 19 Alliance HS
- 17 Nairobi School
- 16 Mang’u HS
- 14 Lenana
- 12 Strathmore
- 10 Moi Forces Academy
- 10 Moi HS Kabarak
- 9 Friends School Kamusinga
- 9 Highway Secondary School
- 9 Kagumo HS
- 9 Upper Hill HS
Where do we work?
The short answer, is all over the Kenyan tech sector, plus many other areas of government, NGOs and private companies. By far and away, most of the people on the list were either students or freelancer/self-employed. Some of the companies that stood out were; Kenya Power, Cellulant, FrontlineSMS, MobiDev, Safaricom, IBM, Kopo Kopo, Ushahidi, Stripe and Google.


July 20, 2013 at 11:53 am
Interesting. I wonder how we would stack up in the Caribbean. I should probably do a survey. Any “must know” thoughts?
July 20, 2013 at 11:55 am
We need tech hubs in Ethiopia, will try to do something about it when I am graduated…but good for Kenyans
July 22, 2013 at 2:43 am
There is one in Ethiopia, it’s called IceAddis and has been around for almost 3 years. http://www.iceaddis.com/
July 20, 2013 at 4:58 pm
I’m a little confused about these statistics. These percentages are compared to the general population or just the number of people using a computers.
July 22, 2013 at 2:43 am
They percentage is of the total who have answered the survey. Sample size is 628.
July 22, 2013 at 7:49 am
Interesting. My School Kangaru School Embu seems to be well represented
July 23, 2013 at 12:43 am
It would be nice to see a progression analysis from the 2010 data… Great insights though!